
Background
At the end of 2019, commissioned by the Auckland City Government of New Zealand, Ewaters New Zealand took on the important task of drawing a fine flood risk map for the entire city of Auckland. This is Ewaters's excellent technical strength to once again undertake an extremely challenging city-wide important project. Ewaters team will use top-level model methods and GIS spatial analysis technology to complete the project task.
For most rural areas, the currently published Auckland floodplain extents were produced from a 2008 RFHA model completed with DHI software. The model fulfilled the previous need for efficient preliminarily flood risk assessments and establishing regional floodplain extents. However, due to better Lidar data availability and the improvement of GIS and modelling technologies, these floodplain maps are either missing in some catchments or showing low confidence in supporting Auckland Council management for the current development.
The existing rural floodplain extents have the following limitations:
1. Maps are mainly based on a 20m grid model results, making ineffective to assess flood risk and any useful analysis.
2. The 2008 modelling work considers 70% imperviousness for the MPD scenario, which is overly conservative for rural areas.
3. Tidal levels are not up to current specifications.
Project objective
The proposed Regional 2D Flood Modelling will incorporate a more comprehensive representation of the floodplain extent, by integrating the latest GIS tools with the latest modelling technologies. The model will still adopt a 20m grid size, but the results can have a much better quality with the 1m sub-grid sampling, which can be further improved with advanced GIS technology to achieve 1m resolution in floodplain extent raster.
The hydrology for the modelling will also incorporate more detail with regard to rainfall distribution and a more realistic MPD scenario based on the Unitary Plan and latest MPD imperviousness allowances.
The model outputs will be exported into GIS to produce a region-wide flood raster of the rural areas stretched into the 1m Lidar DEM, with cross sections and with flows and levels extracted from the model results.
Model Extent
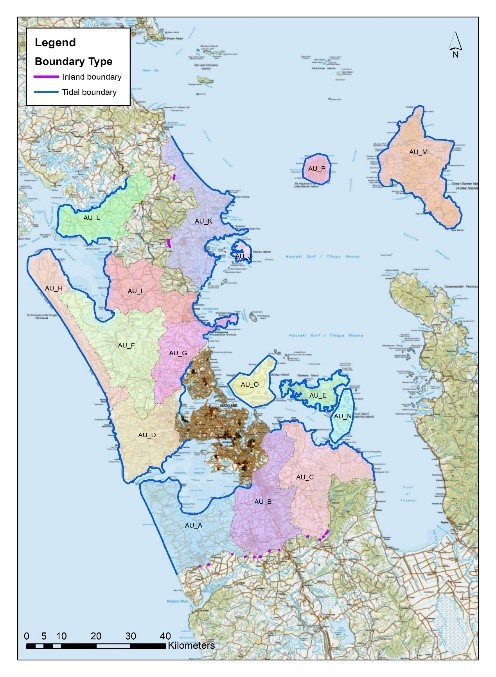
The entire model extent is about 3900 km2 including islands larger than 2km2, excluding the Urban areas where there are extensive modelled flood maps available. The rural Auckland Region will be divided into manageable Modelling Units, in order to carry out both GIS and modelling tasks more efficiently. Each unit will be less than 500 km2 in area and they will be defined during the model schematization phase. Figure below shows the overall model extent, which includes the islands of the region and excludes the major rural areas, which more detail flood models are available. The figure also shows an example of the proposed Modelling Units, which consists of 16 units with an average area of 400 km2, each to cove the rural areas and islands of the Auckland Region.
1. Modelling works will be carried out with the latest TUFLOW model with a 20m grid and a sub-grid sampling (SGS) in 1m. SGS is a new model feature of the latest Tuflow release (Version 2020-01). It provides more accurate results and shows good convergence of flows with different cell resolutions when using coarse cell resolutions.
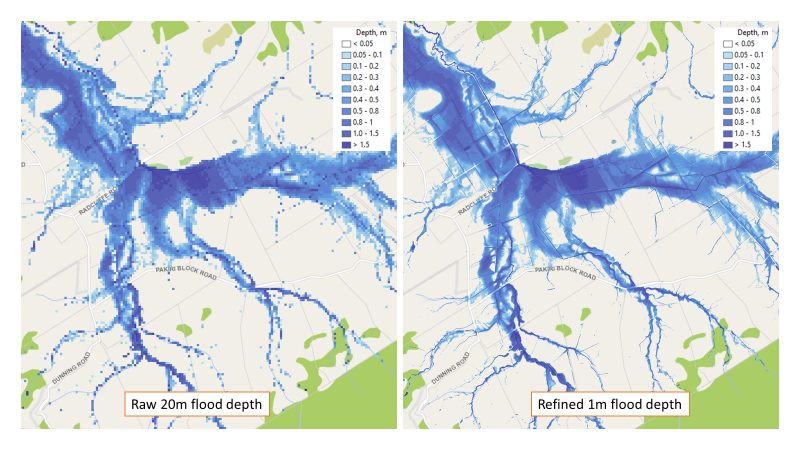
2. Model result refinement technology. 20m raw model outputs can be exported to GIS to be further processed with 1m Lidar 2016, the refined 1m model result will give more details of the flood risk and clearer flood extent boundary.
3. Low flow channel elevation improved. The original 1m Lidar does not provide the accurate low flow channel bottom topography. Through advanced GIS process technology, a more realistic river bottom could be applied to the model by removing the noise along the channel long profile.
4. More accurate predefined cross sections. A dense predefined cross section set has been prepared for the model for model use to query the most critical model results and provide good quality of the flood extent coverage.
The whole model extent of 3900km2 covers more than 70% Auckland region area with 16 model units. A lot of catchment analysis would be processed to retrieve more values and generate hydrological networks for further modelling preparation, such as overland flow path analysis, depressions analysis, road crossings analysis (culverts and bridges), key DEM modifications (key road crossings, and flow enforced DEM if required), flow/level cross sections, AC flood mapping under the latest mapping specifications, among others. With the most advanced modelling and GIS technology of Ewaters, the final 1m resolution model results will provide a more accurate and effective way to assess the flood risk across the whole region and allow extending the modelling work into further details for the areas of more interest at a later stage as and when required.